Hurricane Marco
Aug 20, 2020 to Aug 25, 2020Peak 75 mph991 mb
Hurricane Marco came within 100 miles of 5 U.S. counties without passing within 50.
- Major hurricane
- Hurricane
- Tropical storm
- Post-tropical
Hurricane Marco · 2020
How it happened
Follow the storm’s path, strength and milestones.
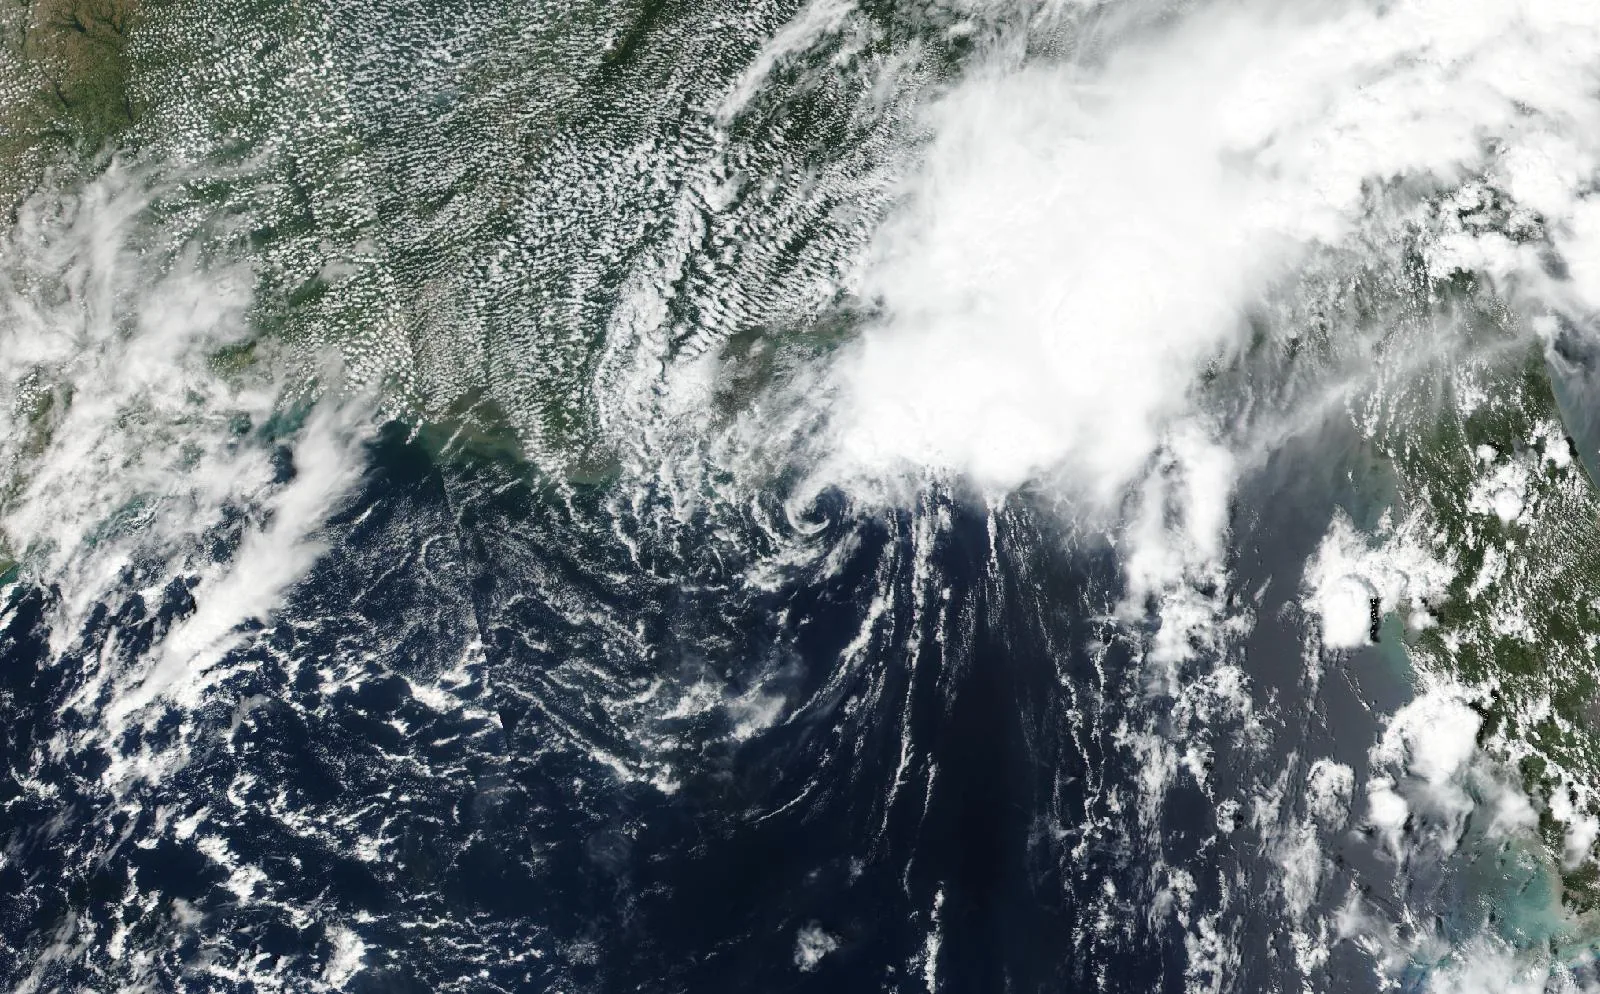
From space
Hurricane Marco on August 24, 2020, about 5 hours before its closest pass to St. Bernard Parish, LA.
The storm
- Peak strength
- Category 1
- 75 mph, 65 kt
- Lowest pressure
- 991 mb
- Over the whole track
- Counties within 50 miles
- 0
- None
- Counties within 100 miles
- 5
- LA, MS
- Landfalls recorded
- 0
- Anywhere on the track
Every county it passed
Closest approach to each county boundary, with the storm’s strength at that moment.
| St. Bernard Parish | LA | 52.1 | Tropical storm |
| St. Tammany Parish | LA | 88.2 | Tropical storm |
| Hancock County | MS | 88.8 | Tropical storm |
| Harrison County | MS | 91.6 | Tropical storm |
| Jackson County | MS | 98.3 | Tropical storm |
Distances are measured from hourly positions interpolated between the National Hurricane Center’s six-hourly fixes to each county boundary. Strength is shown only where the storm was still tropical. Methodology.
National Hurricane Center HURDAT2. Storm totals cover the Atlantic and Northeast and Central Pacific basins.