
- Tornado path, F2/EF2+ (historical)
- State boundary
- Hurricane path (historical)
- State boundary
- Large wildfire (historical)
- State boundary
- Flood insurance claims by county
- State boundary
Every place
has a history.
Explore tornadoes, hurricanes, wildfires
and floods across America.
Explore the record.
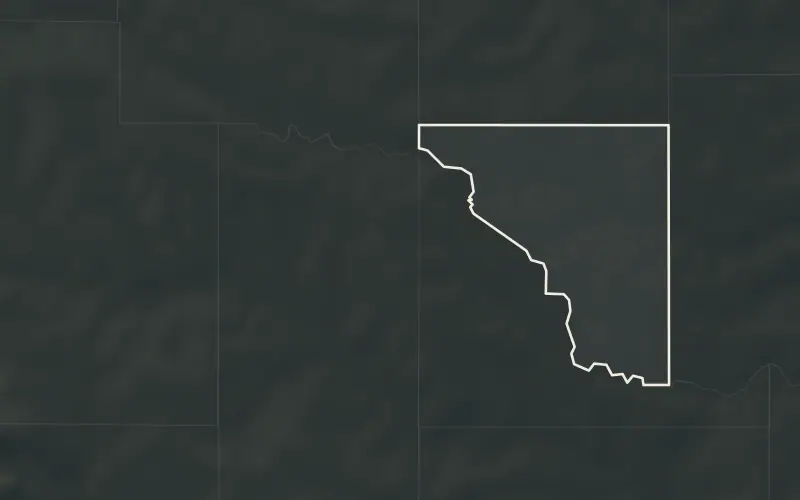
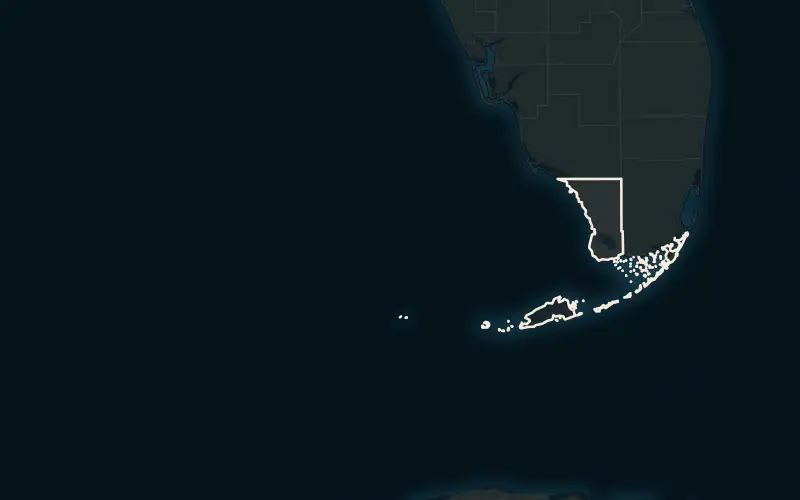
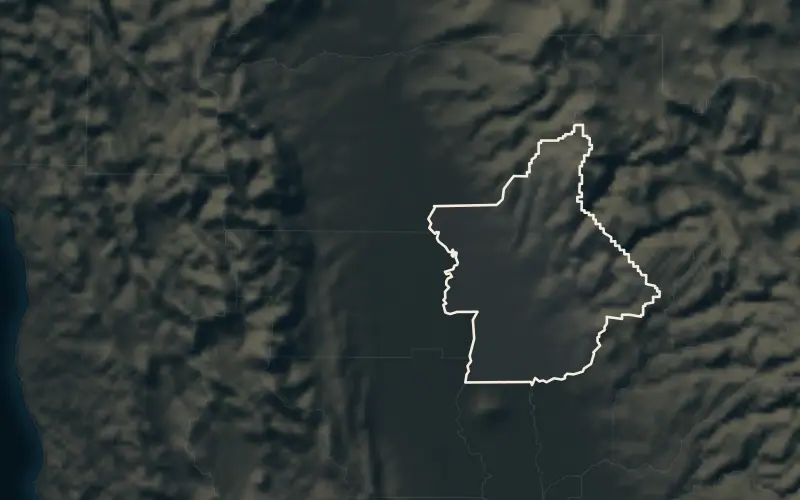
More placesCook County, ILCollin County, TXHarris County, TXOrleans Parish, LAWeld County, COTampa, FLMoore, OK
The national record.
Counties that lead the country in each hazard. Every name opens its full record.
All rankingsMost tornadoes since 1950
- 01Weld County, CO300
- 02Harris County, TX253
- 03Washington County, CO235
- 04Palm Beach County, FL199
- 05Adams County, CO194
Most tropical cyclones within 50 miles
- 01Monroe County, FL112
- 02Hyde County, NC109
- 03Dare County, NC103
- 04Carteret County, NC101
- 05Charleston County, SC97
Largest areas burned since 1984
- 01Yukon-Koyukuk Census Area, AK27.3M
- 02Elko County, NV4.56M
- 03Southeast Fairbanks Census Area, AK3.70M
- 04Malheur County, OR3.21M
- 05Idaho County, ID3.06M
Most flood insurance claims since 1978
- 01Harris County, TX170,854
- 02Jefferson Parish, LA135,664
- 03Orleans Parish, LA127,255
- 04Miami-Dade County, FL62,029
- 05Galveston County, TX60,620
By hazard and over time.
The same record arranged by hazard, by ranking and by date.
- TornadoesEvery F5 and EF5, the deadliest, and tornadoes year by year since 1950.
- HurricanesThe strongest U.S. strikes since 1851 and every storm’s track.
- WildfiresThe largest fires since 1984 with their mapped perimeters.
- FloodsRiver crests at every flood gauge, flood insurance claims and the deadliest floods.
- Hail and windThe biggest severe wind days since 1955 and the largest hailstones.
- EarthquakesThe strongest since 1900, year by year, and where they strike.
- DroughtEvery county's drought index since 1895 and the worst drought years.
- Weather extremesThe hottest, coldest, snowiest and wettest American cities.
- Year by yearEvery year since 1851 in one timeline.
- On this dayWhat struck on each date of the calendar.
Browse by state.
Each state ranks every county and maps its strongest tornadoes, hurricanes and fires. Figures are unique tornadoes since 1950.
All states compared- Alabama2,721
- Alaska5
- Arizona303
- Arkansas2,146
- California486
- Colorado2,479
- Connecticut127
- Delaware77
- District of Columbia6
- Florida3,762
- Georgia2,014
- Hawaii41
- Idaho223
- Illinois3,149
- Indiana1,762
- Iowa3,103
- Kansas4,609
- Kentucky1,259
- Louisiana2,503
- Maine136
- Maryland425
- Massachusetts200
- Michigan1,152
- Minnesota2,216
- Mississippi2,883
- Missouri2,707
- Montana444
- Nebraska3,223
- Nevada97
- New Hampshire101
- New Jersey193
- New Mexico679
- New York536
- North Carolina1,551
- North Dakota1,739
- Ohio1,402
- Oklahoma4,516
- Oregon136
- Pennsylvania993
- Rhode Island20
- South Carolina1,225
- South Dakota1,957
- Tennessee1,479
- Texas9,616
- Utah142
- Vermont50
- Virginia835
- Washington136
- West Virginia177
- Wisconsin1,618
- Wyoming750
What this record is.
Every number on StormWorn comes from a public federal dataset: the Storm Prediction Center’s tornado database, the National Hurricane Center’s storm tracks, NOAA’s Storm Events Database, satellite-mapped fire perimeters, FEMA’s flood insurance claims and disaster declarations, and daily observations from NOAA’s weather stations.
The value is in the joining. We assign every record to the counties and cities it touched, measure storm tracks against county boundaries hour by hour, choose the most representative weather station for each place, and rank each county against its state and the nation. It is a historical record, not a forecast or a risk score. The methodology sets out every rule, and 5,098 federal disaster declarations since 1953 are part of it.