Gold Pan Complex
201343,216 acresIdaho and Montana
The Gold Pan Complex burned 43,216 acres, about 68 square miles, across 2 counties. It began on July 16, 2013.
Watch how it happenedGold Pan Complex · 2013
How it happened
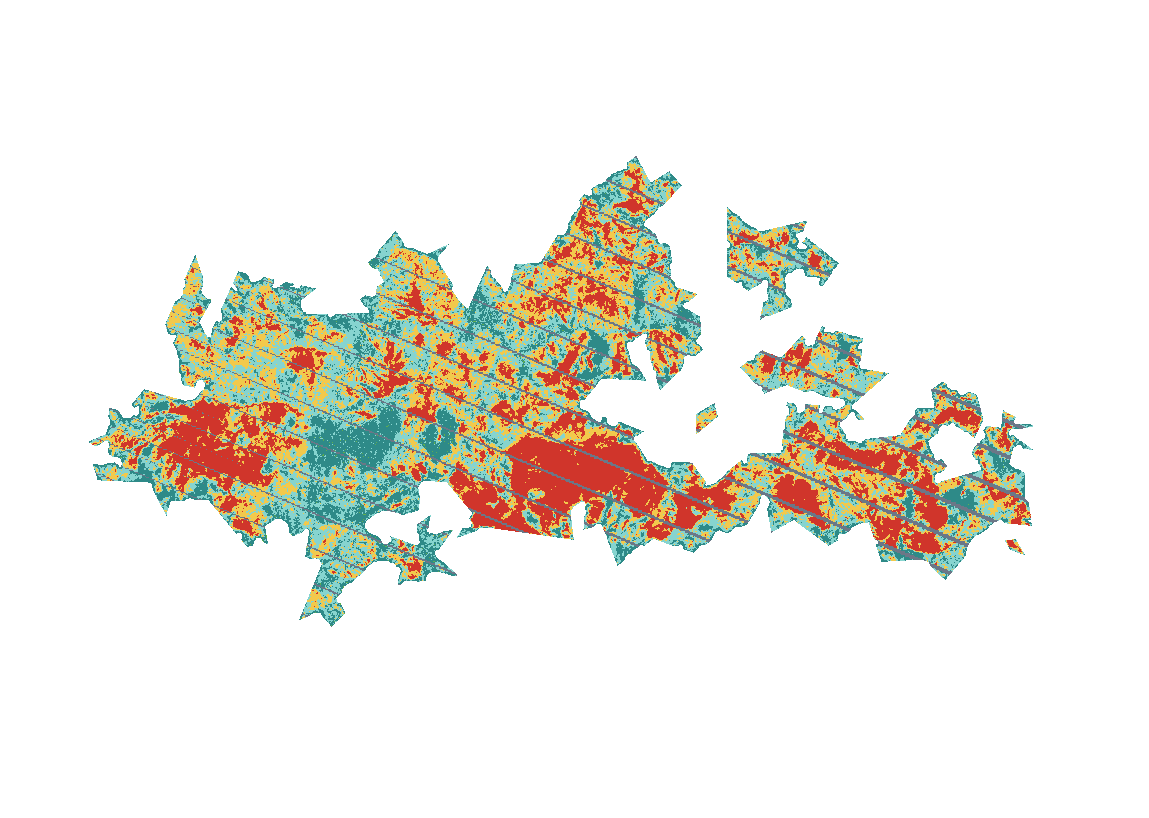
Watch it burn in the order satellites saw it, coloured by how severely each place burned.
How severely it burned
Burn severity inside the final perimeter, classified from Landsat images taken before and after the fire.
| Severity | Share | Acres |
|---|---|---|
| Highmost vegetation consumed, soils altered | 24% | 10,312 |
| Moderatemixed: many trees killed, some survive | 26% | 11,375 |
| Lowsurface fire, most trees survive | 28% | 12,098 |
| Unburned to lowislands inside the perimeter, little change | 15% | 6,558 |
| Increased greennessvegetation greener after the fire than before | 0.1% | 64 |
| Not mappedcloud, shadow or water in the satellite images | 6.5% | 2,809 |
24% of the area inside the perimeter burned at high severity, about 10,312 acres; 50% burned at moderate or high severity.
Monitoring Trends in Burn Severity (U.S. Geological Survey and USDA Forest Service). Classes come from the change in a Landsat burn index (dNBR) between images before and after the fire; acres are each class’s share of the fire’s mapped area.
Where it burned
Acres inside each county, measured from the satellite-mapped perimeter.
| Idaho County | ID | 39,609 |
| Ravalli County | MT | 3,607 |
Other large fires in Idaho and Montana in 2013
- Pony Complex148,112 acres
- Elk Complex129,508 acres
- Beaver Creek Fire111,308 acres
- State Fire30,992 acres
- Little Queens Fire27,541 acres
Monitoring Trends in Burn Severity (USGS and U.S. Forest Service). Type recorded: Wildfire.