Hurricane Cindy
Jul 3, 2005 to Jul 11, 2005Peak 75 mph991 mb
Hurricane Cindy passed within 50 miles of 25 counties in 3 states. It was strongest near Lafourche Parish, LA, as a Category 1 on July 6, 2005.
- Major hurricane
- Hurricane
- Tropical storm
- Post-tropical
Hurricane Cindy · 2005
How it happened
Follow the storm’s path, strength and milestones.
From space
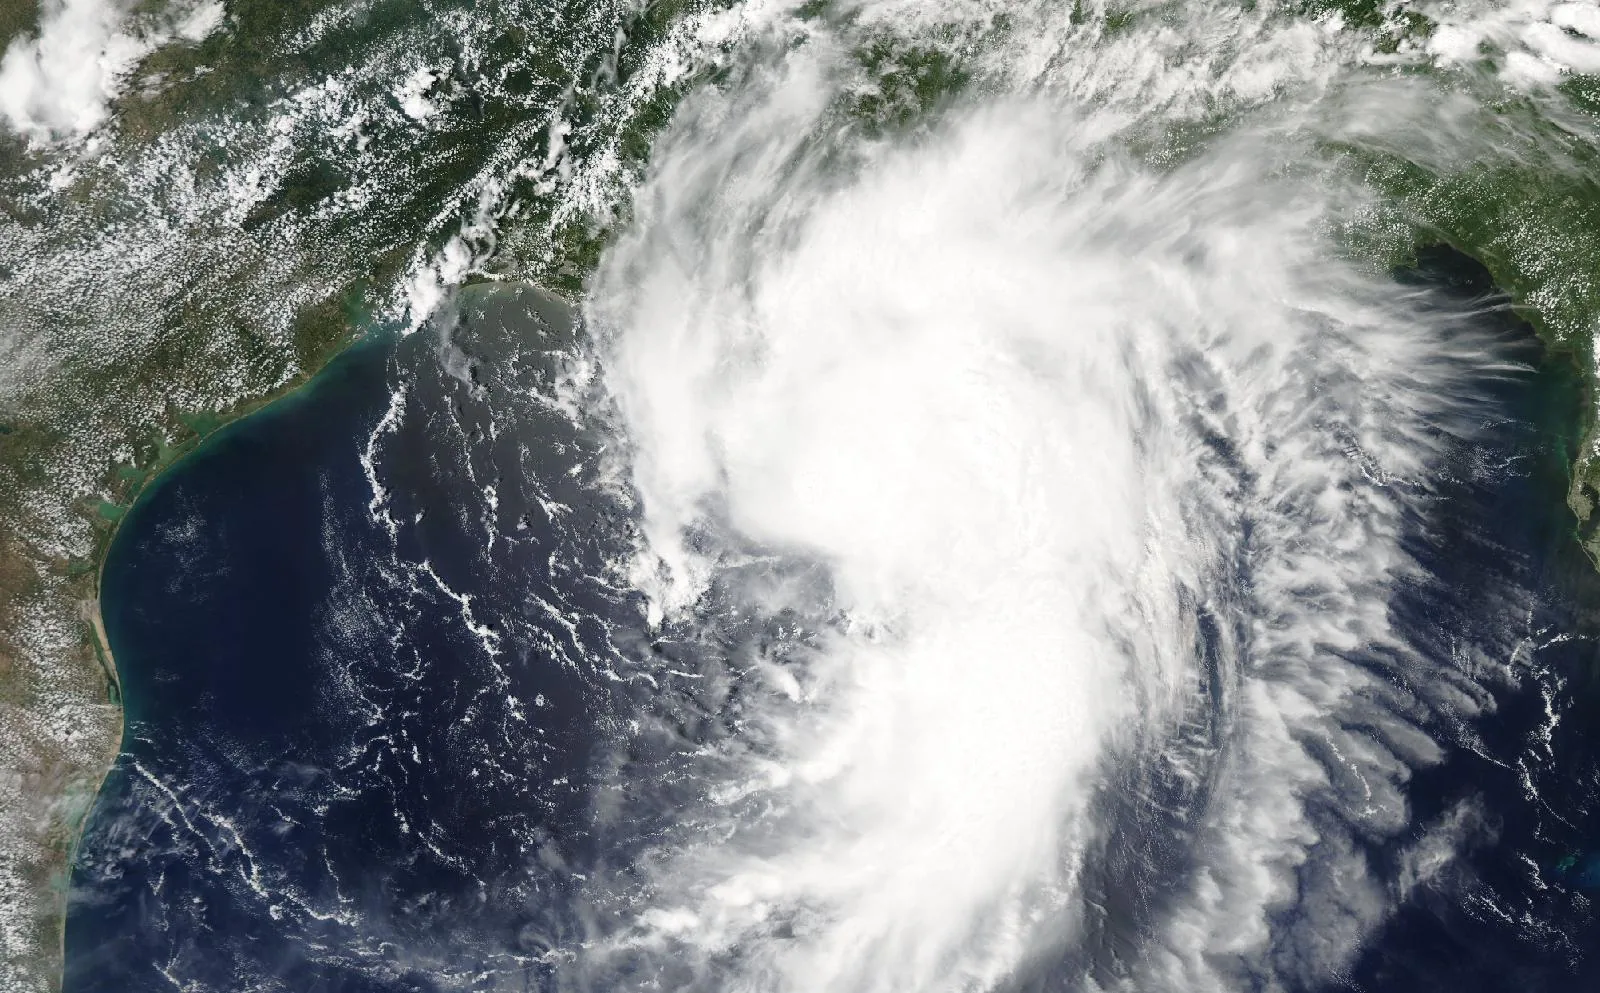
Hurricane Cindy on July 5, 2005, about 7 hours before landfall in Lafourche Parish, LA.
The storm
- Peak strength
- Category 1
- 75 mph, 65 kt
- Lowest pressure
- 991 mb
- Over the whole track
- Counties within 50 miles
- 25
- AL, LA, MS
- Counties within 100 miles
- 47
- AL, LA, MS
- Landfalls recorded
- 3
- Anywhere on the track
Every county it passed
Closest approach to each county boundary, with the storm’s strength at that moment.
| Plaquemines Parish | LA | 0.0 | Tropical storm |
| Lafourche Parish | LA | 0.0 | Category 1 |
| Stone County | MS | 0.0 | Tropical storm |
| Jefferson Parish | LA | 0.0 | Tropical storm |
| George County | MS | 0.0 | Tropical storm |
| Hancock County | MS | 0.0 | Tropical storm |
| Harrison County | MS | 0.0 | Tropical storm |
| Greene County | MS | 0.0 | Tropical storm |
| St. Bernard Parish | LA | 1.4 | Tropical storm |
| St. Tammany Parish | LA | 2.2 | Tropical storm |
| Orleans Parish | LA | 3.5 | Tropical storm |
| Perry County | MS | 4.3 | Tropical storm |
| Jackson County | MS | 4.5 | Tropical storm |
| Mobile County | AL | 7.2 | Tropical storm |
| Pearl River County | MS | 14.7 | Tropical storm |
| St. Charles Parish | LA | 15.1 | Tropical storm |
| Forrest County | MS | 16.0 | Tropical storm |
| Terrebonne Parish | LA | 16.8 | Category 1 |
| Lamar County | MS | 30.3 | Tropical storm |
| Jones County | MS | 30.7 | Tropical storm |
| St. John the Baptist Parish | LA | 32.1 | Tropical storm |
| Tangipahoa Parish | LA | 33.7 | Tropical storm |
| Washington Parish | LA | 37.1 | Tropical storm |
| Marion County | MS | 43.1 | Tropical storm |
| St. James Parish | LA | 44.2 | Tropical storm |
| Livingston Parish | LA | 50.2 | Tropical storm |
| Covington County | MS | 50.9 | Tropical storm |
| Walthall County | MS | 51.8 | Tropical storm |
| Ascension Parish | LA | 54.6 | Tropical storm |
| Assumption Parish | LA | 56.5 | Tropical storm |
| Jefferson Davis County | MS | 59.5 | Tropical storm |
| Smith County | MS | 63.6 | Tropical storm |
| St. Mary Parish | LA | 64.0 | Tropical storm |
| St. Martin Parish | LA | 66.1 | Tropical storm |
| St. Helena Parish | LA | 70.0 | Tropical storm |
| Pike County | MS | 70.5 | Tropical storm |
| East Baton Rouge Parish | LA | 73.6 | Tropical storm |
| Iberville Parish | LA | 73.6 | Tropical storm |
| Lawrence County | MS | 74.6 | Tropical storm |
| Simpson County | MS | 77.8 | Tropical storm |
| Iberia Parish | LA | 79.1 | Tropical storm |
| Amite County | MS | 83.3 | Tropical storm |
| West Baton Rouge Parish | LA | 84.7 | Tropical storm |
| Lincoln County | MS | 85.3 | Tropical storm |
| East Feliciana Parish | LA | 85.8 | Tropical storm |
| Rankin County | MS | 93.1 | Tropical storm |
| Copiah County | MS | 97.7 | Tropical storm |
Distances are measured from hourly positions interpolated between the National Hurricane Center’s six-hourly fixes to each county boundary. Strength is shown only where the storm was still tropical. Methodology.
National Hurricane Center HURDAT2. Storm totals cover the Atlantic and Northeast and Central Pacific basins.