Hurricane Dennis
Jul 4, 2005 to Jul 18, 2005Peak 150 mph930 mb
Hurricane Dennis passed within 50 miles of 23 counties in 3 states. It was strongest near Gulf County, FL, as a Category 4 on July 10, 2005.
- Major hurricane
- Hurricane
- Tropical storm
- Post-tropical
Hurricane Dennis · 2005
How it happened
Follow the storm’s path, strength and milestones.
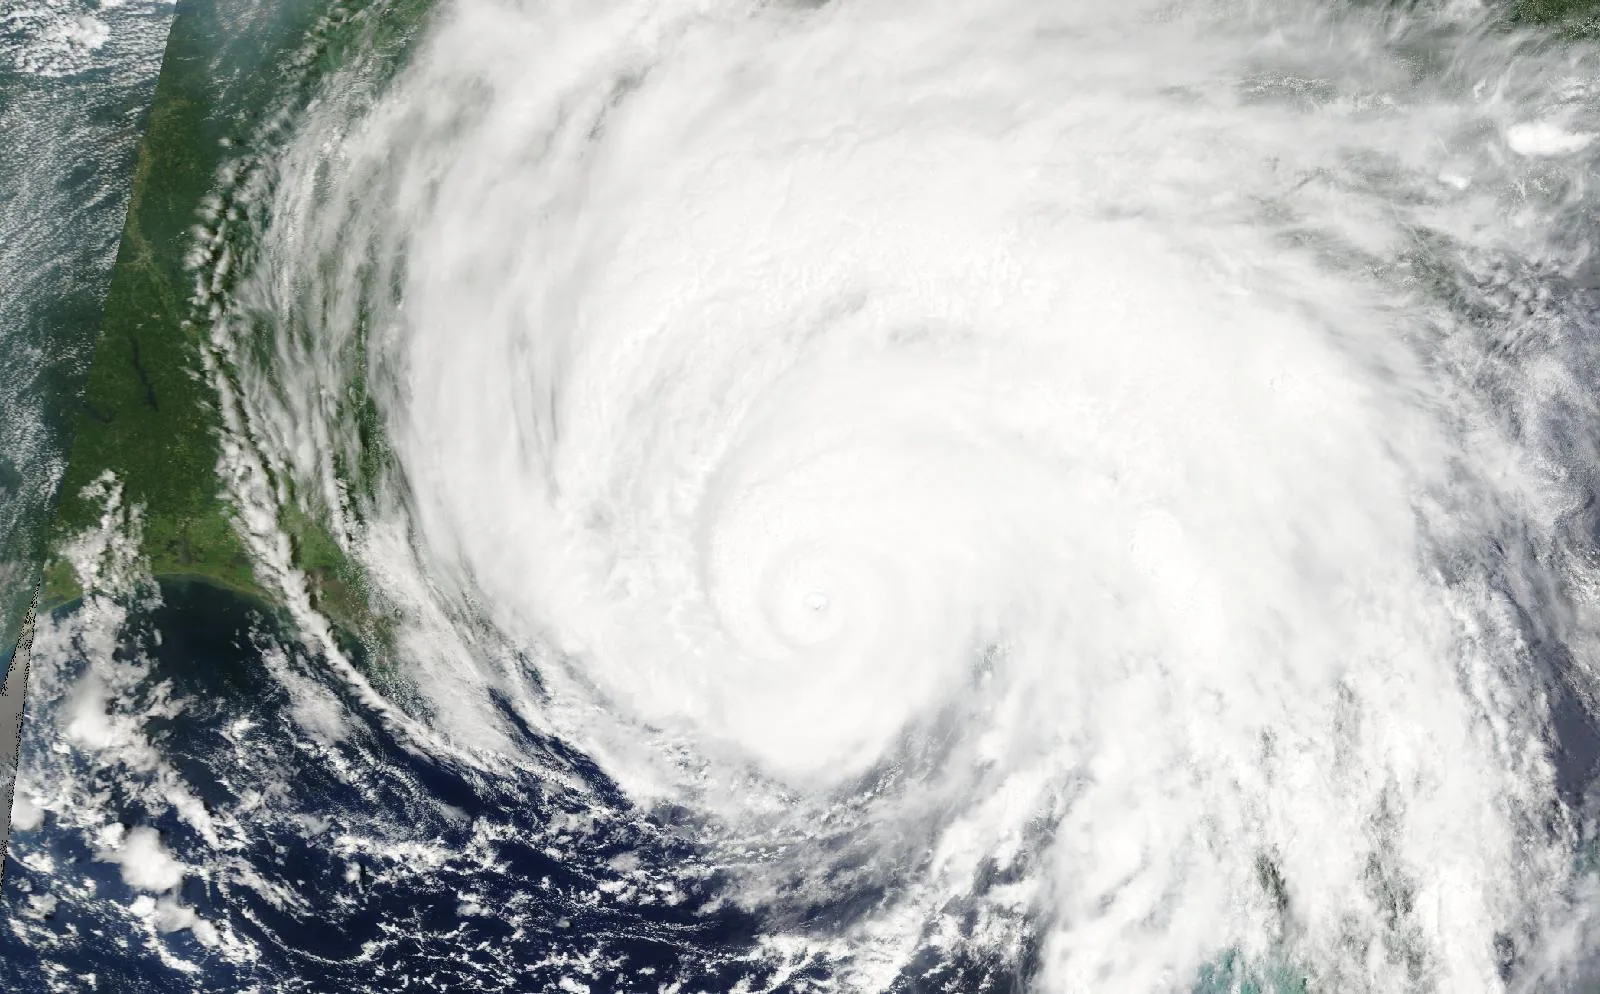
From space
Hurricane Dennis on July 10, 2005, about 3 hours before landfall in Santa Rosa County, FL.
The storm
- Peak strength
- Category 4
- 150 mph, 130 kt
- Lowest pressure
- 930 mb
- Over the whole track
- Counties within 50 miles
- 23
- AL, FL, MS
- Counties within 100 miles
- 49
- AL, FL, MS
- Landfalls recorded
- 4
- Anywhere on the track
Every county it passed
Closest approach to each county boundary, with the storm’s strength at that moment.
| Choctaw County | AL | 0.0 | Tropical storm |
| Santa Rosa County | FL | 0.0 | Category 2 |
| Monroe County | AL | 0.0 | Tropical storm |
| Marengo County | AL | 0.0 | Tropical storm |
| Escambia County | FL | 0.0 | Category 3 |
| Clarke County | AL | 0.0 | Tropical storm |
| Escambia County | AL | 0.0 | Category 1 |
| Baldwin County | AL | 3.0 | Tropical storm |
| Conecuh County | AL | 8.3 | Tropical storm |
| Clarke County | MS | 11.6 | Tropical storm |
| Washington County | AL | 12.2 | Tropical storm |
| Wilcox County | AL | 16.0 | Tropical storm |
| Okaloosa County | FL | 18.0 | Category 3 |
| Mobile County | AL | 23.3 | Tropical storm |
| Wayne County | MS | 24.4 | Tropical storm |
| Hale County | AL | 31.7 | Tropical storm |
| Monroe County | FL | 37.4 | Category 1 |
| Perry County | AL | 38.1 | Tropical storm |
| Covington County | AL | 39.1 | Category 2 |
| Walton County | FL | 39.4 | Category 3 |
| Dallas County | AL | 39.6 | Tropical storm |
| Greene County | MS | 40.1 | Tropical storm |
| Butler County | AL | 45.9 | Tropical storm |
| Jones County | MS | 50.3 | Tropical storm |
| George County | MS | 53.8 | Tropical storm |
| Lowndes County | AL | 58.9 | Tropical storm |
| Perry County | MS | 59.5 | Tropical storm |
| Bay County | FL | 59.9 | Category 3 |
| Jackson County | MS | 61.1 | Category 1 |
| Washington County | FL | 63.0 | Category 3 |
| Crenshaw County | AL | 65.6 | Category 1 |
| Geneva County | AL | 66.7 | Category 3 |
| Holmes County | FL | 67.9 | Category 3 |
| Coffee County | AL | 71.8 | Category 2 |
| Autauga County | AL | 73.7 | Tropical storm |
| Forrest County | MS | 74.8 | Tropical storm |
| Chilton County | AL | 76.1 | Tropical storm |
| Stone County | MS | 81.0 | Tropical storm |
| Gulf County | FL | 81.2 | Category 4 |
| Pike County | AL | 85.0 | Category 1 |
| Montgomery County | AL | 85.0 | Tropical storm |
| Harrison County | MS | 87.7 | Tropical storm |
| Lamar County | MS | 88.0 | Tropical storm |
| Franklin County | FL | 89.3 | Category 4 |
| Calhoun County | FL | 92.2 | Category 3 |
| Dale County | AL | 93.9 | Category 3 |
| Jackson County | FL | 94.9 | Category 3 |
| Elmore County | AL | 97.2 | Tropical storm |
| Houston County | AL | 98.1 | Category 3 |
Distances are measured from hourly positions interpolated between the National Hurricane Center’s six-hourly fixes to each county boundary. Strength is shown only where the storm was still tropical. Methodology.
National Hurricane Center HURDAT2. Storm totals cover the Atlantic and Northeast and Central Pacific basins.