Hurricane Nicole
Nov 6, 2022 to Nov 11, 2022Peak 75 mph980 mb
Hurricane Nicole passed within 50 miles of 37 counties in FL. It was strongest near Martin County, FL, as a Category 1 on November 10, 2022.
- Major hurricane
- Hurricane
- Tropical storm
- Post-tropical
Hurricane Nicole · 2022
How it happened
Follow the storm’s path, strength and milestones.
From space
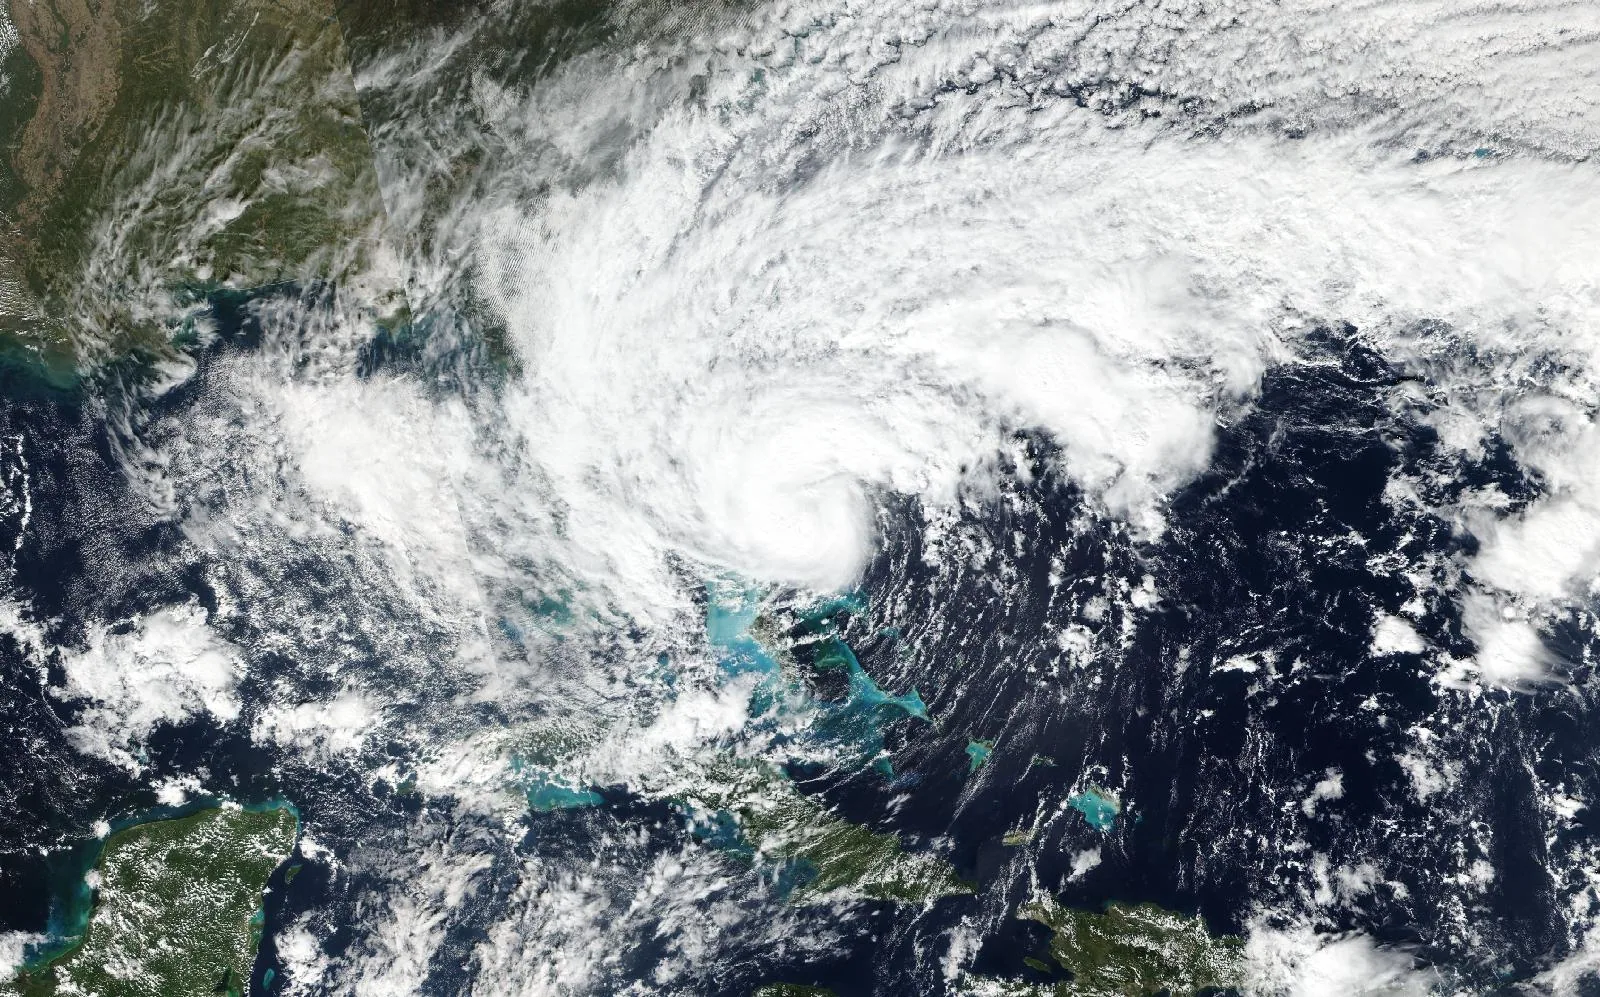
Hurricane Nicole on November 9, 2022, about 13 hours before landfall in Indian River County, FL.
The storm
- Peak strength
- Category 1
- 75 mph, 65 kt
- Lowest pressure
- 980 mb
- Over the whole track
- Counties within 50 miles
- 37
- FL
- Counties within 100 miles
- 57
- FL, GA
- Landfalls recorded
- 5
- Anywhere on the track
Every county it passed
Closest approach to each county boundary, with the storm’s strength at that moment.
| Hernando County | FL | 0.0 | Tropical storm |
| Jefferson County | FL | 0.0 | Tropical storm |
| Leon County | FL | 0.0 | Tropical storm |
| Levy County | FL | 0.0 | Tropical storm |
| Dixie County | FL | 0.0 | Tropical storm |
| Polk County | FL | 0.0 | Tropical storm |
| Osceola County | FL | 0.0 | Tropical storm |
| Sumter County | FL | 0.0 | Tropical storm |
| Indian River County | FL | 0.0 | Category 1 |
| Citrus County | FL | 0.0 | Tropical storm |
| Taylor County | FL | 0.7 | Tropical storm |
| Wakulla County | FL | 1.6 | Tropical storm |
| Lake County | FL | 2.7 | Tropical storm |
| Pasco County | FL | 3.6 | Tropical storm |
| St. Lucie County | FL | 5.7 | Category 1 |
| Brevard County | FL | 7.3 | Tropical storm |
| Okeechobee County | FL | 7.8 | Tropical storm |
| Hillsborough County | FL | 11.7 | Tropical storm |
| Marion County | FL | 14.9 | Tropical storm |
| Highlands County | FL | 15.0 | Tropical storm |
| Orange County | FL | 15.2 | Tropical storm |
| Lafayette County | FL | 15.9 | Tropical storm |
| Martin County | FL | 16.0 | Category 1 |
| Madison County | FL | 16.8 | Tropical storm |
| Gilchrist County | FL | 20.5 | Tropical storm |
| Franklin County | FL | 22.9 | Tropical storm |
| Hardee County | FL | 24.3 | Tropical storm |
| Palm Beach County | FL | 28.5 | Category 1 |
| Alachua County | FL | 31.1 | Tropical storm |
| Suwannee County | FL | 34.2 | Tropical storm |
| Pinellas County | FL | 35.5 | Tropical storm |
| Manatee County | FL | 37.0 | Tropical storm |
| Seminole County | FL | 38.9 | Tropical storm |
| Glades County | FL | 39.0 | Tropical storm |
| DeSoto County | FL | 42.4 | Tropical storm |
| Columbia County | FL | 43.3 | Tropical storm |
| Hamilton County | FL | 49.0 | Tropical storm |
| Volusia County | FL | 52.3 | Tropical storm |
| Hendry County | FL | 53.9 | Tropical storm |
| Putnam County | FL | 55.0 | Tropical storm |
| Union County | FL | 55.9 | Tropical storm |
| Sarasota County | FL | 58.2 | Tropical storm |
| Bradford County | FL | 59.5 | Tropical storm |
| Echols County | GA | 62.0 | Tropical storm |
| Charlotte County | FL | 62.5 | Tropical storm |
| Clay County | FL | 67.2 | Tropical storm |
| Broward County | FL | 68.3 | Category 1 |
| Baker County | FL | 68.6 | Tropical storm |
| Flagler County | FL | 70.8 | Tropical storm |
| Lee County | FL | 80.3 | Tropical storm |
| St. Johns County | FL | 84.6 | Tropical storm |
| Duval County | FL | 88.7 | Tropical storm |
| Collier County | FL | 90.5 | Tropical storm |
| Miami-Dade County | FL | 91.2 | Category 1 |
| Ware County | GA | 91.4 | Tropical storm |
| Charlton County | GA | 91.7 | Tropical storm |
| Nassau County | FL | 92.6 | Tropical storm |
Distances are measured from hourly positions interpolated between the National Hurricane Center’s six-hourly fixes to each county boundary. Strength is shown only where the storm was still tropical. Methodology.
National Hurricane Center HURDAT2. Storm totals cover the Atlantic and Northeast and Central Pacific basins.