Hurricane Beryl
Jun 28, 2024 to Jul 11, 2024Peak 167 mph932 mb
Hurricane Beryl passed within 50 miles of 35 counties in TX. It was strongest near Matagorda County, TX, as a Category 1 on July 8, 2024.
- Major hurricane
- Hurricane
- Tropical storm
- Post-tropical
Hurricane Beryl · 2024
How it happened
Follow the storm’s path, strength and milestones.
From space
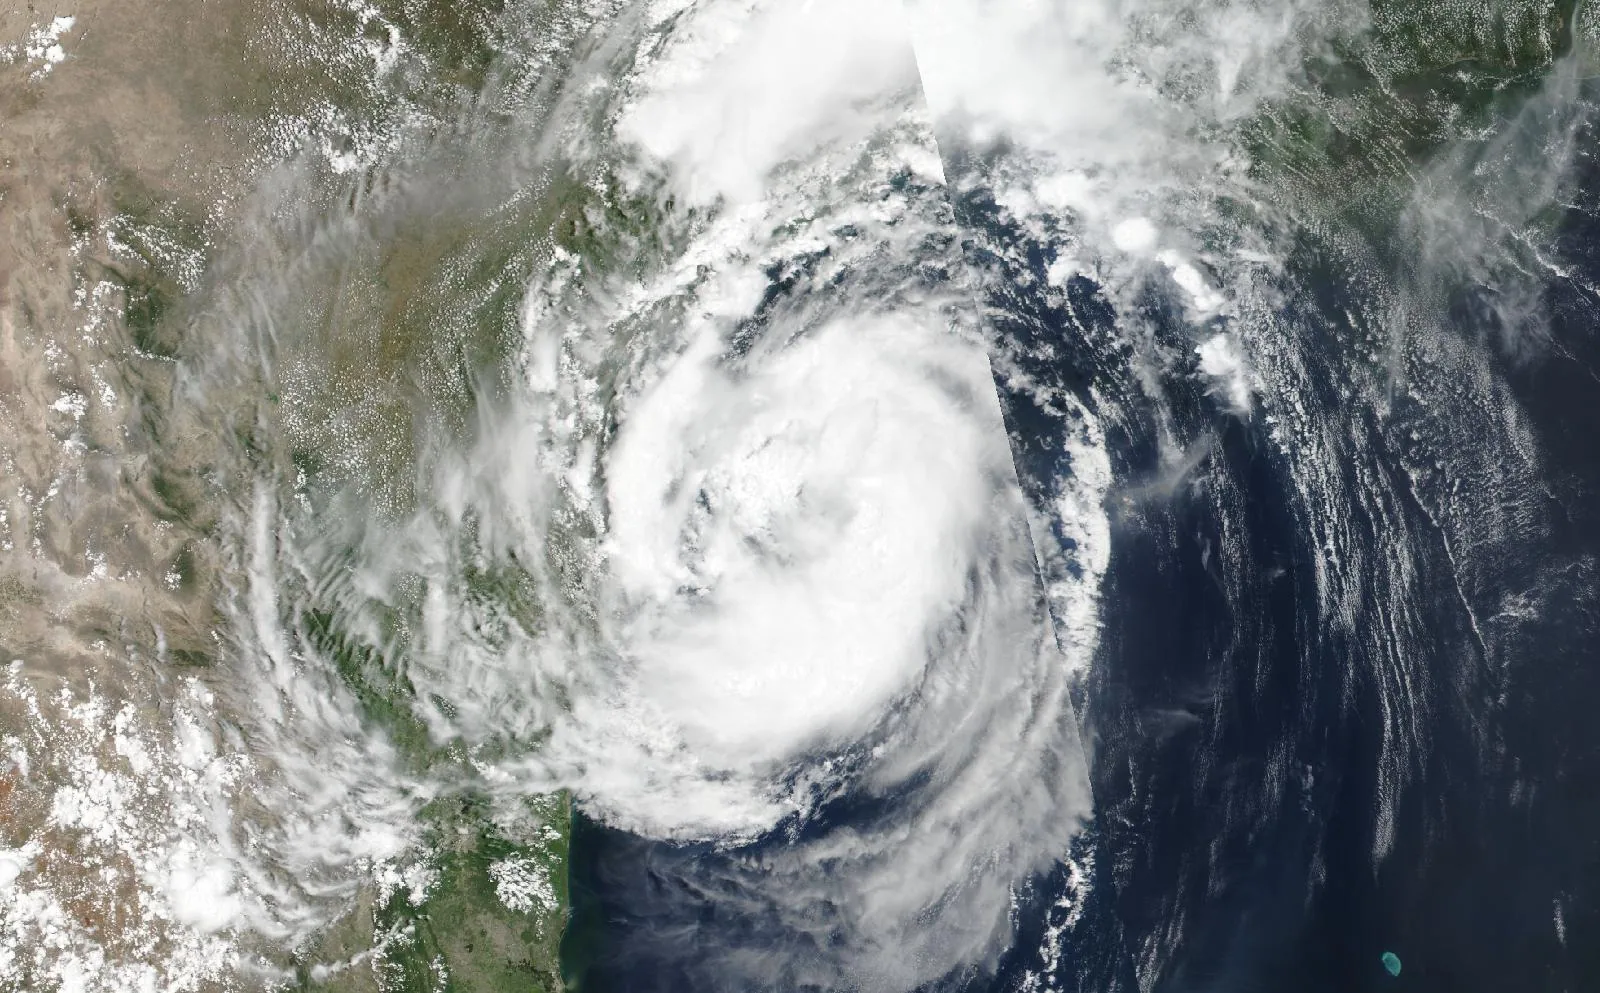
Hurricane Beryl on July 7, 2024, about 13 hours before landfall in Matagorda County, TX.
The storm
- Peak strength
- Category 5
- 167 mph, 145 kt
- Lowest pressure
- 932 mb
- Over the whole track
- Counties within 50 miles
- 35
- TX
- Counties within 100 miles
- 62
- TX
- Landfalls recorded
- 3
- Anywhere on the track
Every county it passed
Closest approach to each county boundary, with the storm’s strength at that moment.
| Montgomery County | TX | 0.0 | Tropical storm |
| Fort Bend County | TX | 0.0 | Category 1 |
| Walker County | TX | 0.0 | Tropical storm |
| Houston County | TX | 0.0 | Tropical storm |
| Matagorda County | TX | 0.0 | Category 1 |
| Harris County | TX | 0.0 | Tropical storm |
| Cherokee County | TX | 0.0 | Tropical storm |
| Wharton County | TX | 0.0 | Category 1 |
| Waller County | TX | 2.8 | Tropical storm |
| Trinity County | TX | 2.9 | Tropical storm |
| Grimes County | TX | 4.3 | Tropical storm |
| Austin County | TX | 7.3 | Category 1 |
| Anderson County | TX | 7.6 | Tropical storm |
| Madison County | TX | 7.7 | Tropical storm |
| Brazoria County | TX | 9.0 | Category 1 |
| San Jacinto County | TX | 10.4 | Tropical storm |
| Angelina County | TX | 14.5 | Tropical storm |
| Colorado County | TX | 16.1 | Category 1 |
| Polk County | TX | 18.4 | Tropical storm |
| Calhoun County | TX | 19.6 | Category 1 |
| Jackson County | TX | 19.6 | Category 1 |
| Leon County | TX | 20.0 | Tropical storm |
| Washington County | TX | 20.6 | Tropical storm |
| Brazos County | TX | 24.7 | Tropical storm |
| Liberty County | TX | 31.0 | Tropical storm |
| Lavaca County | TX | 33.9 | Category 1 |
| Burleson County | TX | 34.4 | Tropical storm |
| Freestone County | TX | 35.1 | Tropical storm |
| Victoria County | TX | 39.1 | Category 1 |
| Galveston County | TX | 41.8 | Tropical storm |
| Robertson County | TX | 42.5 | Tropical storm |
| Tyler County | TX | 43.3 | Tropical storm |
| Fayette County | TX | 44.2 | Tropical storm |
| Refugio County | TX | 48.2 | Category 1 |
| Chambers County | TX | 49.7 | Tropical storm |
| Aransas County | TX | 51.1 | Category 1 |
| Jasper County | TX | 53.2 | Tropical storm |
| Hardin County | TX | 53.6 | Tropical storm |
| Limestone County | TX | 54.1 | Tropical storm |
| Lee County | TX | 54.3 | Tropical storm |
| DeWitt County | TX | 59.0 | Category 1 |
| Milam County | TX | 59.6 | Tropical storm |
| Navarro County | TX | 60.0 | Tropical storm |
| Falls County | TX | 68.8 | Tropical storm |
| Goliad County | TX | 70.3 | Category 1 |
| Gonzales County | TX | 72.0 | Category 1 |
| Bastrop County | TX | 72.1 | Tropical storm |
| Nueces County | TX | 73.0 | Category 1 |
| Jefferson County | TX | 76.9 | Tropical storm |
| San Patricio County | TX | 77.9 | Category 1 |
| Newton County | TX | 79.2 | Tropical storm |
| Caldwell County | TX | 84.8 | Category 1 |
| Bee County | TX | 85.4 | Category 1 |
| Williamson County | TX | 86.2 | Tropical storm |
| Kleberg County | TX | 86.8 | Category 1 |
| McLennan County | TX | 87.8 | Tropical storm |
| Bell County | TX | 89.4 | Tropical storm |
| Hill County | TX | 91.1 | Tropical storm |
| Orange County | TX | 93.7 | Tropical storm |
| Karnes County | TX | 95.4 | Category 1 |
| Kenedy County | TX | 97.9 | Tropical storm |
| Travis County | TX | 98.1 | Tropical storm |
Distances are measured from hourly positions interpolated between the National Hurricane Center’s six-hourly fixes to each county boundary. Strength is shown only where the storm was still tropical. Methodology.
National Hurricane Center HURDAT2. Storm totals cover the Atlantic and Northeast and Central Pacific basins.