Hurricane Claudette
Jul 7, 2003 to Jul 17, 2003Peak 92 mph979 mb
Hurricane Claudette passed within 50 miles of 37 counties in TX. It was strongest near Matagorda County, TX, as a Category 1 on July 15, 2003.
- Major hurricane
- Hurricane
- Tropical storm
- Post-tropical
Hurricane Claudette · 2003
How it happened
Follow the storm’s path, strength and milestones.
From space
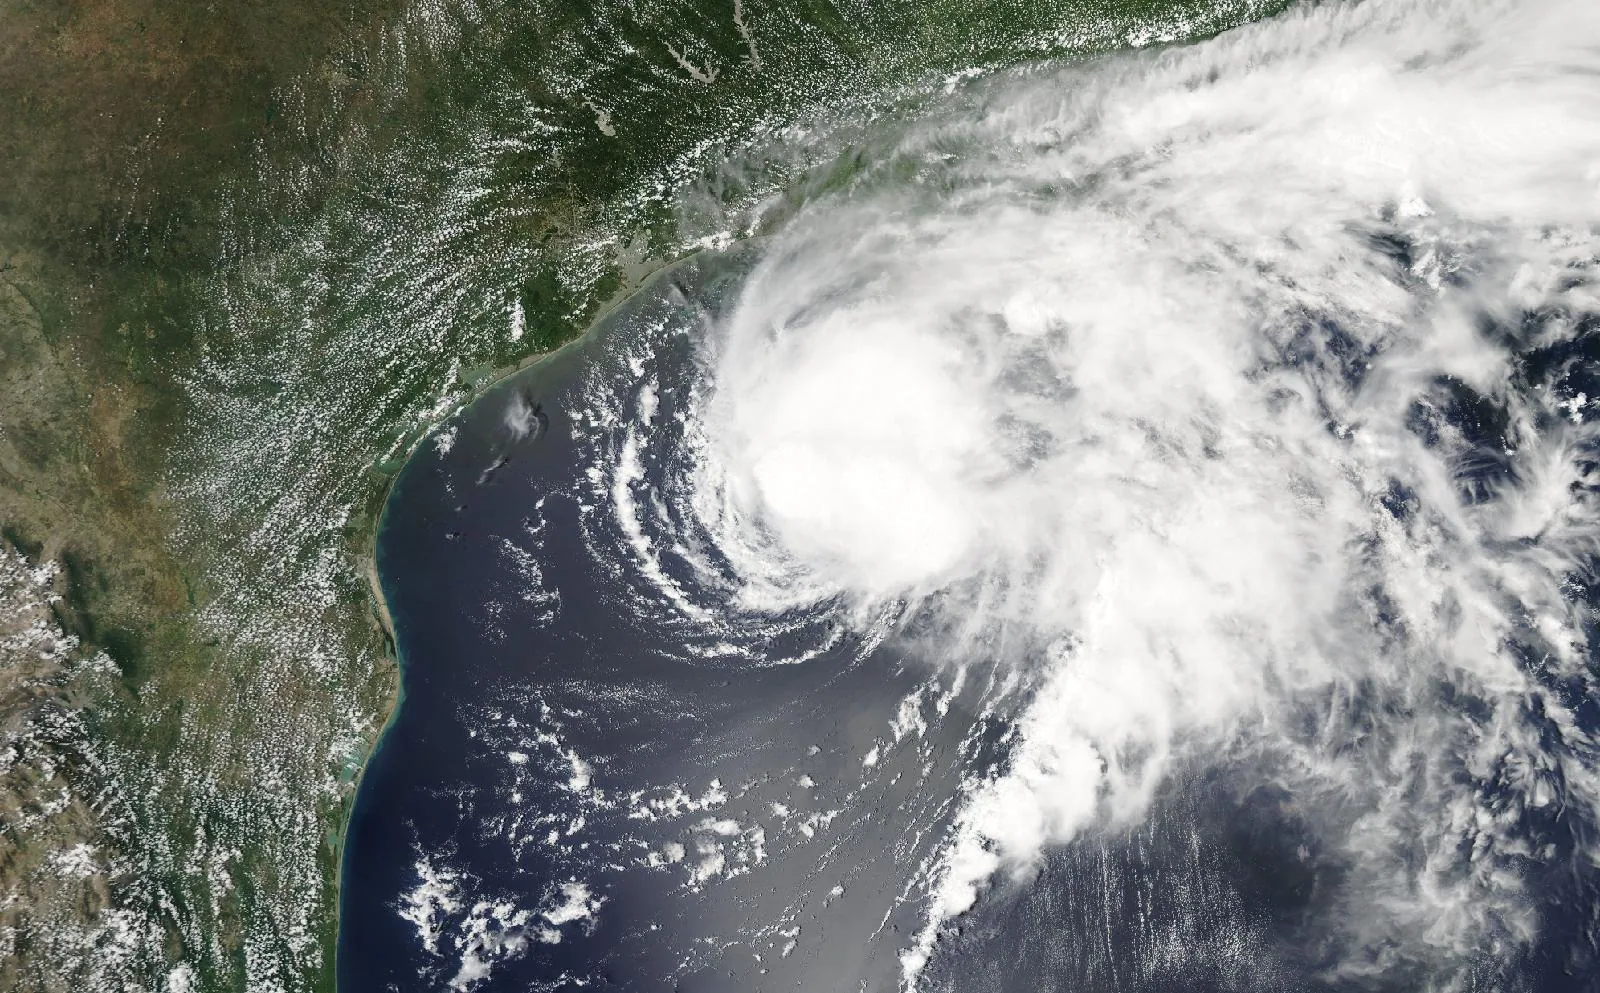
Hurricane Claudette on July 14, 2003, about 20 hours before landfall in Matagorda County, TX.
The storm
- Peak strength
- Category 1
- 92 mph, 80 kt
- Lowest pressure
- 979 mb
- Over the whole track
- Counties within 50 miles
- 37
- TX
- Counties within 100 miles
- 63
- TX
- Landfalls recorded
- 2
- Anywhere on the track
Every county it passed
Closest approach to each county boundary, with the storm’s strength at that moment.
| Victoria County | TX | 0.0 | Category 1 |
| Bee County | TX | 0.0 | Tropical storm |
| Dimmit County | TX | 0.0 | Tropical storm |
| Calhoun County | TX | 0.0 | Category 1 |
| McMullen County | TX | 0.0 | Tropical storm |
| Brewster County | TX | 0.0 | Tropical storm |
| Maverick County | TX | 0.0 | Tropical storm |
| Zavala County | TX | 0.0 | Tropical storm |
| La Salle County | TX | 0.0 | Tropical storm |
| Goliad County | TX | 0.0 | Tropical storm |
| Live Oak County | TX | 0.0 | Tropical storm |
| Refugio County | TX | 2.1 | Category 1 |
| Matagorda County | TX | 3.2 | Category 1 |
| Atascosa County | TX | 8.7 | Tropical storm |
| Karnes County | TX | 9.3 | Tropical storm |
| Frio County | TX | 9.7 | Tropical storm |
| Aransas County | TX | 15.2 | Category 1 |
| Jackson County | TX | 15.2 | Category 1 |
| DeWitt County | TX | 18.3 | Tropical storm |
| Webb County | TX | 20.4 | Tropical storm |
| Kinney County | TX | 21.2 | Tropical storm |
| San Patricio County | TX | 24.8 | Tropical storm |
| Wilson County | TX | 26.4 | Tropical storm |
| Uvalde County | TX | 29.9 | Tropical storm |
| Val Verde County | TX | 30.4 | Tropical storm |
| Jim Wells County | TX | 30.6 | Tropical storm |
| Duval County | TX | 30.6 | Tropical storm |
| Lavaca County | TX | 32.1 | Category 1 |
| Brazoria County | TX | 36.3 | Category 1 |
| Nueces County | TX | 37.2 | Tropical storm |
| Wharton County | TX | 38.3 | Category 1 |
| Gonzales County | TX | 38.9 | Tropical storm |
| Medina County | TX | 39.8 | Tropical storm |
| Terrell County | TX | 41.3 | Tropical storm |
| Bexar County | TX | 42.5 | Tropical storm |
| Colorado County | TX | 47.4 | Category 1 |
| Pecos County | TX | 48.9 | Tropical storm |
| Edwards County | TX | 56.6 | Tropical storm |
| Guadalupe County | TX | 58.4 | Tropical storm |
| Galveston County | TX | 59.2 | Category 1 |
| Kleberg County | TX | 60.3 | Tropical storm |
| Real County | TX | 66.6 | Tropical storm |
| Fort Bend County | TX | 66.6 | Category 1 |
| Fayette County | TX | 71.4 | Category 1 |
| Bandera County | TX | 72.7 | Tropical storm |
| Caldwell County | TX | 74.7 | Tropical storm |
| Comal County | TX | 75.8 | Tropical storm |
| Jim Hogg County | TX | 78.9 | Tropical storm |
| Crockett County | TX | 80.8 | Tropical storm |
| Zapata County | TX | 81.6 | Tropical storm |
| Austin County | TX | 83.4 | Category 1 |
| Bastrop County | TX | 84.0 | Category 1 |
| Kendall County | TX | 84.1 | Tropical storm |
| Hays County | TX | 85.4 | Tropical storm |
| Brooks County | TX | 85.4 | Tropical storm |
| Harris County | TX | 85.5 | Category 1 |
| Kenedy County | TX | 86.0 | Tropical storm |
| Kerr County | TX | 88.7 | Tropical storm |
| Waller County | TX | 93.2 | Category 1 |
| Chambers County | TX | 94.4 | Category 1 |
| Sutton County | TX | 95.0 | Tropical storm |
| Lee County | TX | 99.2 | Category 1 |
| Blanco County | TX | 99.3 | Tropical storm |
Distances are measured from hourly positions interpolated between the National Hurricane Center’s six-hourly fixes to each county boundary. Strength is shown only where the storm was still tropical. Methodology.
National Hurricane Center HURDAT2. Storm totals cover the Atlantic and Northeast and Central Pacific basins.