Hurricane Barry
Jul 10, 2019 to Jul 16, 2019Peak 75 mph993 mb
Hurricane Barry passed within 50 miles of 33 counties in 2 states. It was strongest near Vermilion Parish, LA, as a Category 1 on July 13, 2019.
- Major hurricane
- Hurricane
- Tropical storm
- Post-tropical
Hurricane Barry · 2019
How it happened
Follow the storm’s path, strength and milestones.
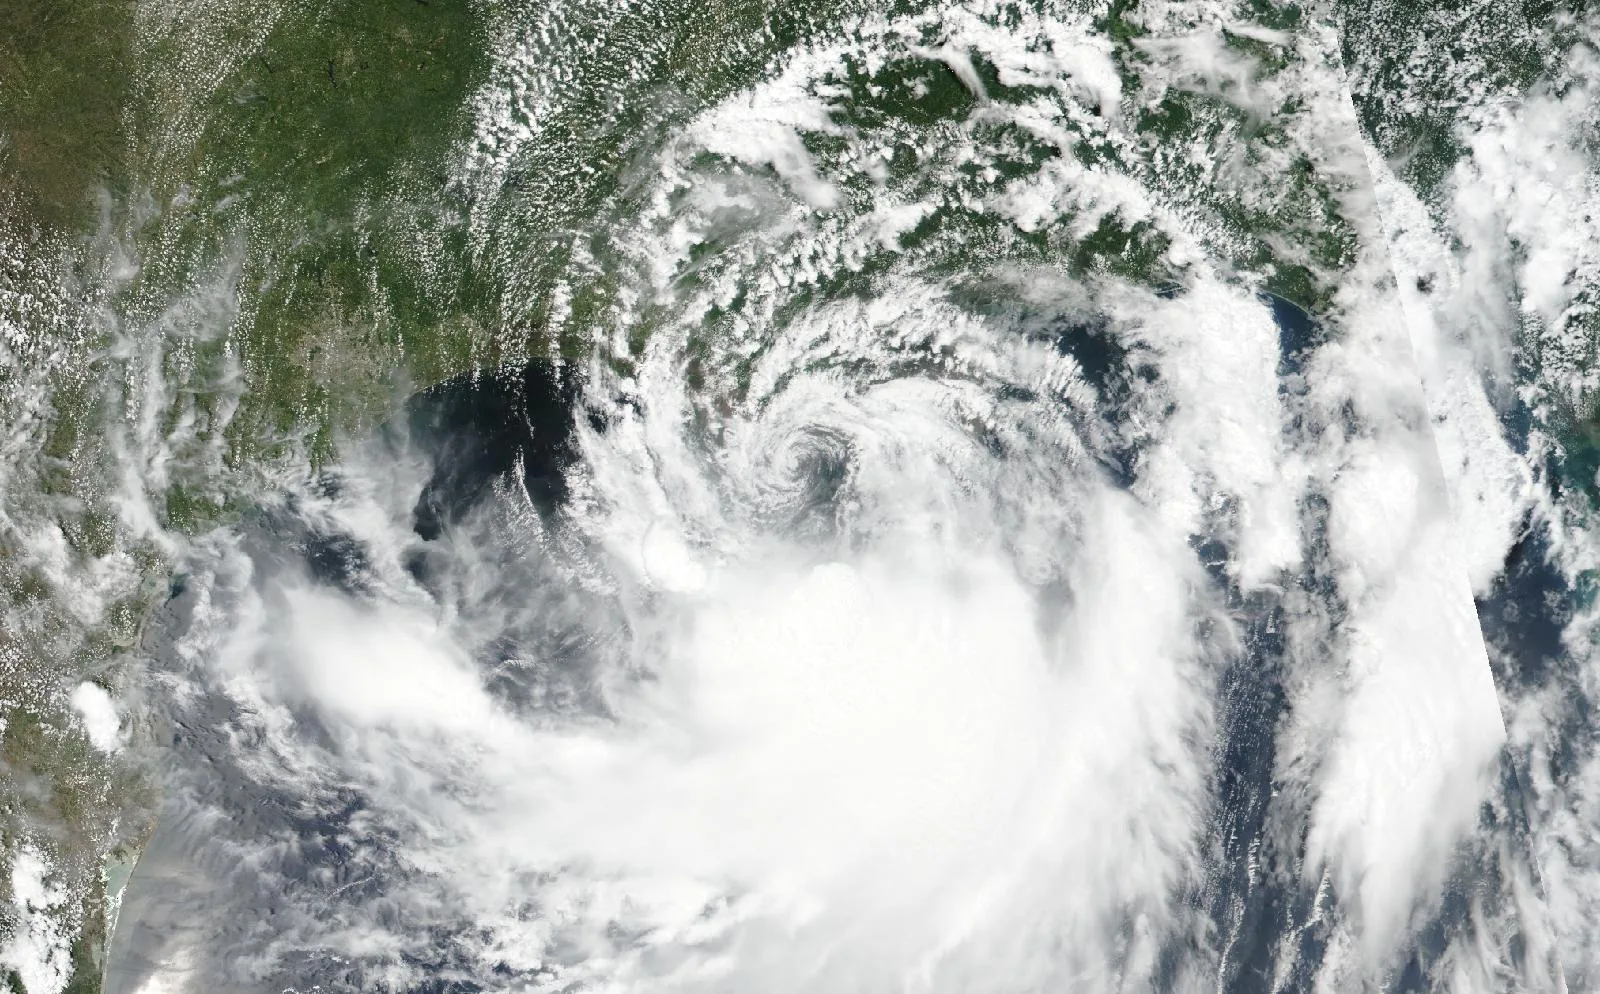
From space
Hurricane Barry on July 12, 2019, about 19 hours before landfall in Vermilion Parish, LA.
The storm
- Peak strength
- Category 1
- 75 mph, 65 kt
- Lowest pressure
- 993 mb
- Over the whole track
- Counties within 50 miles
- 33
- LA, TX
- Counties within 100 miles
- 66
- LA, MS, TX
- Landfalls recorded
- 1
- Anywhere on the track
Every county it passed
Closest approach to each county boundary, with the storm’s strength at that moment.
| De Soto Parish | LA | 0.0 | Tropical storm |
| Vernon Parish | LA | 0.0 | Tropical storm |
| Acadia Parish | LA | 0.0 | Tropical storm |
| Beauregard Parish | LA | 0.0 | Tropical storm |
| Sabine Parish | LA | 0.0 | Tropical storm |
| Caddo Parish | LA | 0.0 | Tropical storm |
| Allen Parish | LA | 0.0 | Tropical storm |
| Vermilion Parish | LA | 0.0 | Category 1 |
| Jefferson Davis Parish | LA | 0.0 | Tropical storm |
| Red River Parish | LA | 1.7 | Tropical storm |
| Natchitoches Parish | LA | 4.4 | Tropical storm |
| Cameron Parish | LA | 5.3 | Tropical storm |
| Iberia Parish | LA | 6.7 | Category 1 |
| Bienville Parish | LA | 9.7 | Tropical storm |
| Evangeline Parish | LA | 11.5 | Tropical storm |
| Calcasieu Parish | LA | 12.9 | Tropical storm |
| Newton County | TX | 13.5 | Tropical storm |
| Sabine County | TX | 13.9 | Tropical storm |
| Lafayette Parish | LA | 15.7 | Tropical storm |
| Rapides Parish | LA | 15.7 | Tropical storm |
| Shelby County | TX | 16.4 | Tropical storm |
| St. Landry Parish | LA | 18.3 | Tropical storm |
| St. Mary Parish | LA | 19.8 | Category 1 |
| Terrebonne Parish | LA | 25.9 | Tropical storm |
| San Augustine County | TX | 28.6 | Tropical storm |
| St. Martin Parish | LA | 29.4 | Tropical storm |
| Grant Parish | LA | 31.2 | Tropical storm |
| Winn Parish | LA | 31.5 | Tropical storm |
| Jasper County | TX | 34.5 | Tropical storm |
| Jackson Parish | LA | 44.1 | Tropical storm |
| Avoyelles Parish | LA | 44.4 | Tropical storm |
| Nacogdoches County | TX | 47.5 | Tropical storm |
| Angelina County | TX | 47.8 | Tropical storm |
| Lafourche Parish | LA | 51.1 | Tropical storm |
| Assumption Parish | LA | 51.7 | Tropical storm |
| Orange County | TX | 52.2 | Tropical storm |
| Iberville Parish | LA | 54.5 | Tropical storm |
| Pointe Coupee Parish | LA | 55.1 | Tropical storm |
| Tyler County | TX | 56.1 | Tropical storm |
| LaSalle Parish | LA | 61.1 | Tropical storm |
| Hardin County | TX | 61.2 | Tropical storm |
| Jefferson Parish | LA | 64.6 | Tropical storm |
| West Baton Rouge Parish | LA | 69.2 | Tropical storm |
| Jefferson County | TX | 69.4 | Tropical storm |
| Catahoula Parish | LA | 69.9 | Tropical storm |
| Ascension Parish | LA | 70.5 | Category 1 |
| Plaquemines Parish | LA | 71.8 | Tropical storm |
| Caldwell Parish | LA | 71.9 | Tropical storm |
| Polk County | TX | 72.2 | Tropical storm |
| West Feliciana Parish | LA | 72.8 | Tropical storm |
| St. James Parish | LA | 73.5 | Category 1 |
| East Baton Rouge Parish | LA | 75.8 | Tropical storm |
| Concordia Parish | LA | 77.6 | Tropical storm |
| Wilkinson County | MS | 80.4 | Tropical storm |
| Cherokee County | TX | 80.5 | Tropical storm |
| St. John the Baptist Parish | LA | 83.1 | Tropical storm |
| East Feliciana Parish | LA | 83.5 | Tropical storm |
| Trinity County | TX | 84.0 | Tropical storm |
| St. Charles Parish | LA | 86.8 | Tropical storm |
| Houston County | TX | 87.2 | Tropical storm |
| Adams County | MS | 88.1 | Tropical storm |
| Richland Parish | LA | 90.8 | Tropical storm |
| Livingston Parish | LA | 91.1 | Tropical storm |
| Liberty County | TX | 94.8 | Tropical storm |
| Franklin Parish | LA | 95.1 | Tropical storm |
| Chambers County | TX | 98.3 | Tropical storm |
Distances are measured from hourly positions interpolated between the National Hurricane Center’s six-hourly fixes to each county boundary. Strength is shown only where the storm was still tropical. Methodology.
National Hurricane Center HURDAT2. Storm totals cover the Atlantic and Northeast and Central Pacific basins.